Verification and Validation
RfbFoam has been verified against COMSOL Multiphysics and validated against experimental data from iron symmetric RFB cells. The validation case is located in examples/verification-validation/.
Running the Validation Study
The validation workflow consists of three steps: mesh preparation, parametric batch simulation, and plotting.
1. Prepare the Mesh
cd examples/verification-validation/FTFF_Model.run_470um
./Run_Prepare_Only.sh
This generates the mesh (blockMesh, snappyHexMesh) and initializes the material property fields (setExprFields).
2. Run the Parametric Sweep
From the repository root, launch the batch controller:
cd batch_run
python MainControl.py
The script sweeps 10 applied potentials at two inlet velocities, producing two polarization curves. All sweep parameters and flags are pre-configured in MainControl.py but can be customized (see Batch Processing for details).
3. Plot the Results
Once all simulations have completed, generate the comparison plots using MATLAB:
cd examples/verification-validation/plot_results/compare_comsol
matlab -batch "Plot"    # Overpotential comparison with COMSOL

cd ../validation
matlab -batch "Plot"    # Polarization curve validation against experimental data
The scripts produce SVG figures saved in their respective directories.
Verification: Comparison with COMSOL
The verification was conducted through comparison with an equivalent model implemented in COMSOL Multiphysics, with both solvers operating under identical boundary conditions, material properties, and geometric configurations.
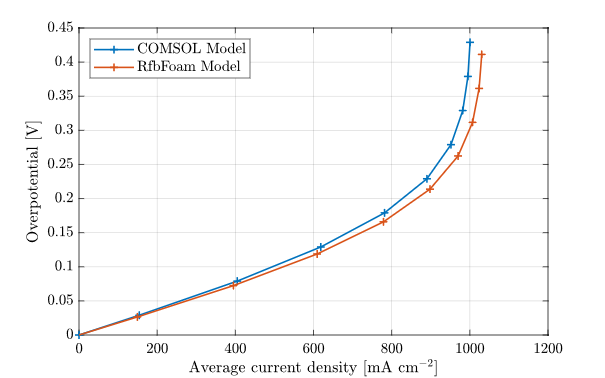 Comparing the COMSOL model output with RfbFoam results for the FTFF case with 10.58 mL/min flow rate. All geometrical and physical parameters are identical.
The comparison demonstrates close agreement between the two implementations, with both curves exhibiting nearly identical trends and magnitudes throughout the entire current density range. The slight deviations observed at higher current densities (above 800 mA/cm²) are attributed to differences in numerical discretization schemes and convergence criteria between the two software packages.
Experimental Validation
The experimental validation was conducted through comparison with laboratory measurements from all-iron RFB cells with NIPS electrodes for the FTFF case.
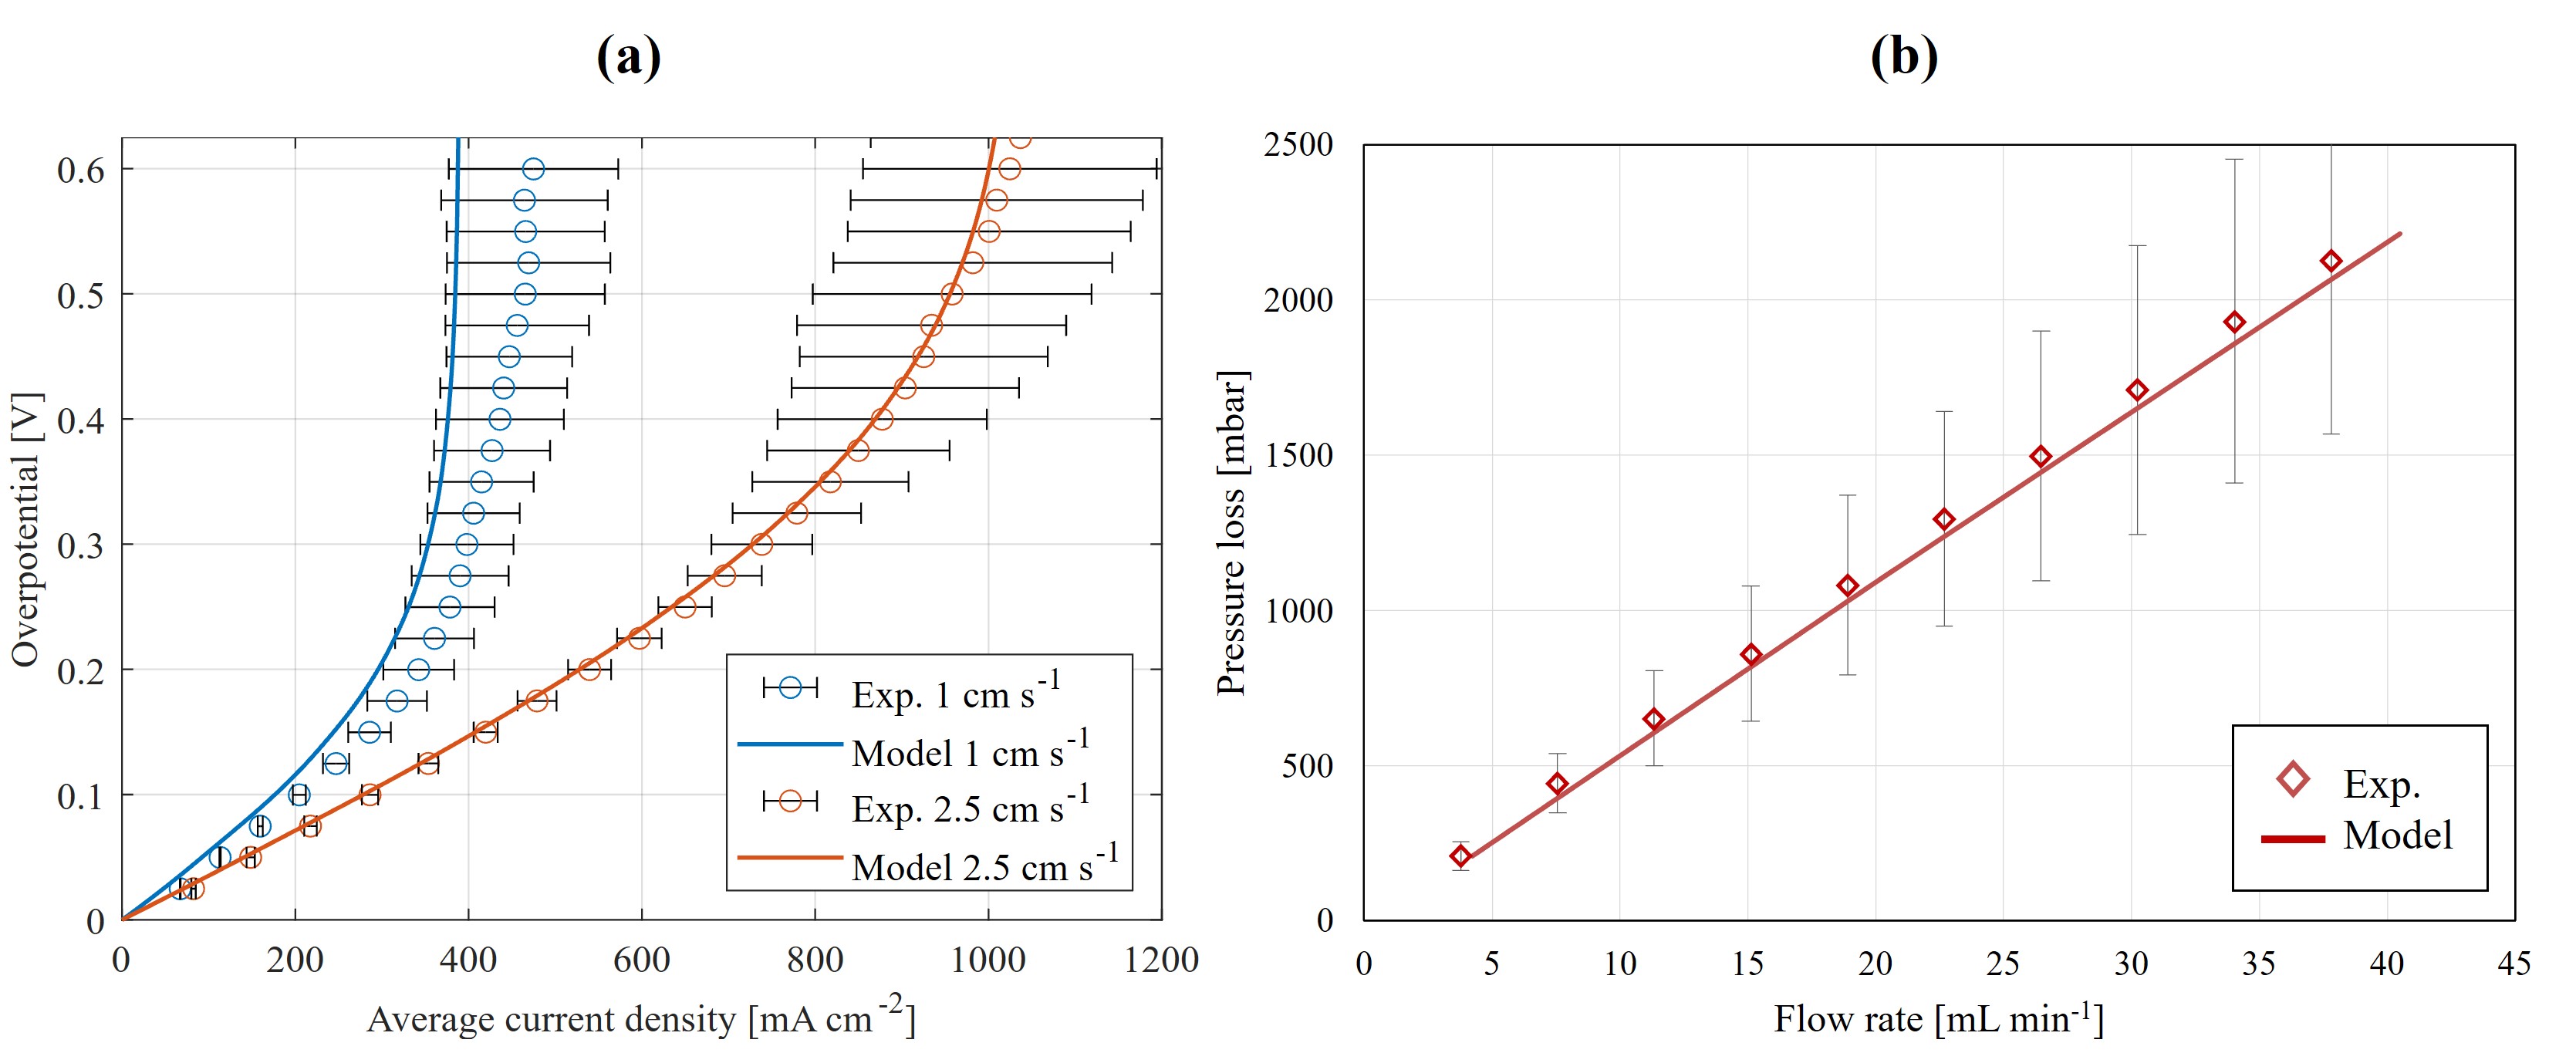 Validation results for the experiments with NIPS electrodes in the FTFF setup: (a) half-cell polarization curves at two different inlet superficial velocities, and (b) pressure drop versus flow rate.
Polarization Curves
The polarization curves comparing experimental data with model predictions at two different inlet flow rates (4.23 and 10.58 mL/min, converted to 0.51 and 1.37 cm/s inlet velocities) show close agreement with no parameter fitting, with deviations remaining within the experimental uncertainty bounds.
Pressure Drop
The pressure drop validation confirms the model's ability to accurately predict hydrodynamic behavior. The linear relationship between pressure loss and flow rate is well-reproduced, with predicted values consistently falling within experimental error margins across 5 to 40 mL/min.
Computational Performance
The validation simulations were executed using the provided Python parametric sweep code on a local workstation employing 16 CPU cores, with each data point of the polarization curve requiring approximately 2 minutes of computational time. For more demanding applications, the model can be readily deployed on HPC environments.
Experimental Setup and Parameters
The electrode characterization was carried out within a symmetric Fe²⁺/Fe³⁺ cell:
- Electrode: NIPS electrode with 2.55 cm² active area, 0.470 mm thickness (~20% compression)
- Membrane: Cationic exchange membrane (CEM) FS-950 by Fumasep, 0.05 mm thickness
- Electrolyte: 50 mL solution of 0.25M Fe²⁺ and 0.25M Fe³⁺ in 2M HCl
- Flow rates tested: 4.23 and 10.58 mL/min (corresponding to 0.51 and 1.37 cm/s inlet velocities)
Inlet Velocities
| Internal linear velocity [cm/s] | Flow rate [mL/min] | Inlet velocity [cm/s] |
|---|---|---|
| 1 | 4.23 | 0.51 |
| 2.5 | 10.58 | 1.37 |
Electrode Properties
| Symbol | Description | Value | Source |
|---|---|---|---|
| Permeability | m² | Measured | |
| Porosity (compressed) | 0.91 (0.83) | Measured | |
| Surface area | m²/m³ | Measured | |
| Tortuosity | Measured | ||
| Conductivity | S/m | Measured | |
| Exchange current density | mA/cm² | Measured | |
| Mass transfer prefactor | Fitted | ||
| Mass transfer exponent | 0.9847 | Fitted |
Electrolyte Properties
| Symbol | Description | Value | Source |
|---|---|---|---|
| Fe²⁺ diffusion coefficient | m²/s | Literature | |
| Fe³⁺ diffusion coefficient | m²/s | Literature | |
| Fe²⁺ initial concentration | 250 mol/m³ | Estimated | |
| Fe³⁺ initial concentration | 250 mol/m³ | Estimated | |
| Electrolyte density | 1015 kg/m³ | Literature | |
| Electrolyte viscosity | Pa·s | Literature | |
| Electrolyte conductivity | S/m | Measured | |
| Equilibrium potential | 0.771 V | Literature |
Mass Transfer Correlation
The mass transfer coefficients are set uniformly as a function of the superficial velocity :
Experimental Half-Cell Overpotential
Since the modeling domain comprises only a single half-cell, experimental polarization data are corrected to represent a single half-cell overpotential:
where cm² is the geometric area and is the ohmic resistance of the membrane. The division by 2 reflects equal distribution of overpotential between both sides of the symmetric cell.
This assumption might not hold for sluggish or asymmetric redox couples (like in vanadium RFBs).