Chapter 5 Extending the model: simulating local pH evolution
This chapter is based on a manuscript prepared to be submitted: M. Barzegari, C. Wang, S.V. Lamaka, G. Zavodszky, and L. Geris, “Interface-coupled multiphysics computational modeling of local pH changes during the biodegradation of magnesium biomaterials.”
This chapter is partially based on a manuscript prepared to be submitted:
M. Barzegari, C. Wang, S.V. Lamaka, G. Zavodszky, and L. Geris, “Interface-coupled multiphysics computational modeling of local pH changes during the biodegradation of magnesium biomaterials.”
In this chapter, the basic biodegradation model developed in Chapter 3 is further developed to capture more advanced chemistry occurring at the corrosion interface in HBSS solutions, making it possible to simulate more complex environments and local pH changes during the biodegradation process.
5.1 Introduction
Mg is the most studied biodegradable metal [172, 299, 55, 295], on which many research groups have performed valuable biodegradation studies [77, 166, 19, 148]. The biodegradation behavior of Mg is investigated in in vitro corrosion tests, in which the selection of the corrosive media plays an important role since it affects the underlying chemical reactions [193]. By considering the main application of the biomaterial, which can be tissue engineering scaffolds, vascular stents, or orthopedic fixation implants, the corrosive media can be selected to be a representative of the service environment. The most basic form of the medium is a saline (NaCl) solution, in which the degradation rate is the highest possible [193]. More complex solutions can be used to mimic the behavior of the body environment by taking into account additional body fluid components, the most popular of which are Ringer’s solution, PBS (phosphate buffered saline), SBFs (simulated body fluids), HBSS (Hank’s balanced salt solution), and Earle’s balanced salt solution (EBSS) [193]. Adding more organic components to the solution will make it ready to simulate cell culture conditions. The common media for this purpose are MEM (Minimum Essential medium) and DMEM (Dulbecco’s modified Eagle’s medium) [193].
Various studies have already investigated the effect of different components in the aforementioned corrosive media on the degradation behavior of Mg materials [192, 292, 137, 154, 191]. A typical composition of ”simulated body fluid” solutions (such as SBF, HBSS, and EBSS) is chloride, carbonate, phosphates, sulfate, and calcium. The individual effect of these components on the rate of degradation of Mg has been extensively studied, in which it has been observed that carbonate and phosphate slow down the rate while the effect of sulfate is negligible [137, 191]. The concentration of affects the pH buffering capacity and the degradation rate of Mg simultaneously [282].
The effect of calcium ions is more complex because it has been found that doesn’t contribute to the Mg corrosion directly [276], but a mixed effect of , , , and forms a co-precipitation layer on the corroded surface of Mg, slowing down the corrosion rate of commercially pure Mg as well as of some Mg alloys [192, 154]. It has also been reported that although various Mg alloys show different intrinsic degradation behavior in NaCl solution, they possibly behave similarly in simulated body fluids [6, 191]. Since the humoral regulations inside the human body control the changes in pH of body fluids, it is common to use pH buffers to mimic a similar condition, but it should be taken into account that buffering solutions may affect the degradation rate of Mg [61, 142] and may also delay the formation of the precipitate layer [154]. An alternative solution to address this issue is to use natural pH buffers such as , an option that is commonly used for immersion tests under cell culture conditions. In this situation, an equilibrium between , , and keeps the pH constant. As a result, using simulated body fluids for corrosion tests without additional synthetic pH buffers is still acceptable [154, 191].
The major reactions occurring in simulated body fluids can be written as:
The protection layer is formed on the corroded surface as a hydroxyapatite-like precipitation according to the following reaction [20, 243, 240, 136]:
| (5.10) | ||||
In fact, the similarity in corrosion behavior of various Mg alloys in SBF solutions is due to the similar composition of this quasi-protective layer, a mechanism that doesn’t occur in NaCl solution, leading to a more apparent difference in degradation rate between Mg alloys. The composition of the formed hydroxyapatite-like precipitation layer is close to the ones found in vivo [193]. Additionally, local pH measurements in HBSS and SBF show that, in contrast to saline solutions, the local pH value is not alkaline [154, 194]. This has been reported for hydrodynamics situations, under which the medium composition is kept constant by replacing the consumed ions by means of fluid flow.
Building mathematical and computational models of the biodegradation process in complex buffered solutions can help save the resources required to perform in vitro tests, but the details of the aforementioned chemistry are challenging to capture in a mechanistic model. Few attempts have been made to model the underlying chemical reactions in SBF solutions [119, 69, 290], but due to the complexity of the resulting mathematical models, it is not feasible to extend them to 3D and real-world cases, like for simulation of the degradation of biomedical implants. In the case of data-driven approaches [291], the applicability is limited to the studied conditions, making it difficult for developed models to achieve high extensibility and generalizability.
In this chapter, a detailed mathematical model is presented to extend the work discussed in Chapter 3 and [31], in which a mechanistic model of the biodegradation process is coupled with a thermodynamics-based code to predict local interfacial biodegradation of Mg in HBSS solutions. The local pH changes are the validation criterion to compare the simulation results with experimental ones. Besides other parameters affecting the Mg biodegradation mechanism, monitoring the pH changes at the degradation interface has proved to be significant due to its direct effect on the formation and stability of the degradation products layer [92].
5.2 Methods
5.2.1 Experimental setup
In this study, the corrosion tests were performed on ultra-high pure (UHP) and commercially pure (CP) Mg in hydrodynamics conditions. The elemental composition of the used materials is shown in Table 5.1, measured by Atomic Absorption Spectrometer (AAS). The samples were prepared as rod shapes with a diameter of mounted in epoxy resin with a disc shape. The electrolyte used for corrosion tests was commercial HBSS (ThermoFisher Scientific, no. 14025100), the composition of which is presented in Table 5.2.
| Fe | Si | Mn | Al | Cu | Ni | |
| CP-Mg | 0.03420 | 0.0001 | 0.00237 | 0.00402 | 0.00037 | ¡0.0002 |
| UHP-Mg | 0.0012 | ¡0.0001 | 0.00037 | 0.00291 | ¡0.0001 | ¡0.0002 |
| Components | mM |
| 5.33 | |
| 0.44 | |
| 4.17 | |
| 137.9 | |
| 0.34 | |
| 1.26 | |
| 0.49 | |
| 0.41 | |
| 5.56 |
Local pH measurements were performed using a glass-type pH microelectrode with a tip diameter of (Unisense, pH-10). The electrode was positioned above the sample at a distance of . At this distance, a line scan mapping routine was performed to obtain the horizontal pH profiles, in which a specimen-centered area (, which was used as the simulation domain as well) was mapped with the step length of . The sampling interval was 3 s, the result of which was a total duration of approximately 1 hour to scan the area. Similarly, the vertical pH profiles were scanned starting at the height of above the midpoint of the specimen up to in the bulk medium. Fig. 5.1 demonstrates the setup of the experiment schematically, in which the flow enters the chamber from the left with a rate of (Medorex TL15E peristaltic pump) and leaves it to the right. The tests were performed independently at room temperature (RT, in an air-conditioned lab) and (Thermo Scientific SAHARA S13).

The in vitro cross-section morphology of the specimens was characterized using a dual beam FIB/SEM platform (LYRA3 TESCAN) equipped with an EDX system (Oxford Inca with a silicon drift detector), the result of which was used to compare qualitatively with the simulation predictions.
5.2.2 Computational model construction
The computational model in the current study comprises three coupled modules:
- 1.
-
2.
A thermodynamics-based simulation to estimate the concentration of various components of the electrolyte in regions close to the surface of the sample based on the calculated pH of module 1.
-
3.
A module to link the former two, calculating the hydroxyapatite-like precipitation concentration, in which calculated pH values were transferred from module 1 to module 2 for each node of the computational mesh to calculate the concentration of ions depending on the computed local pH and transfer back the calculated precipitation concentration to module 1.
Fig. 5.2 shows a schematic representation of the coupled modules and the way that simulation data are being transferred between them. It should be noted that the results obtained from module 2 are calculated in an equilibrium state as it is a thermodynamics-based code, but module 1 works based on kinetics equations and calculations. As a result, it is assumed that the kinetics of the reactions is affected by the equilibrium state of involved chemical components in each time step, which can be considered as a small time window in which the chemical species are in equilibrium. This fact should be seen as an assumption made for simplifying the calculation of the stoichiometry of the protective layer (Eq. 5.10), in which the effect of the underlying kinetics on the change of pH is neglected.
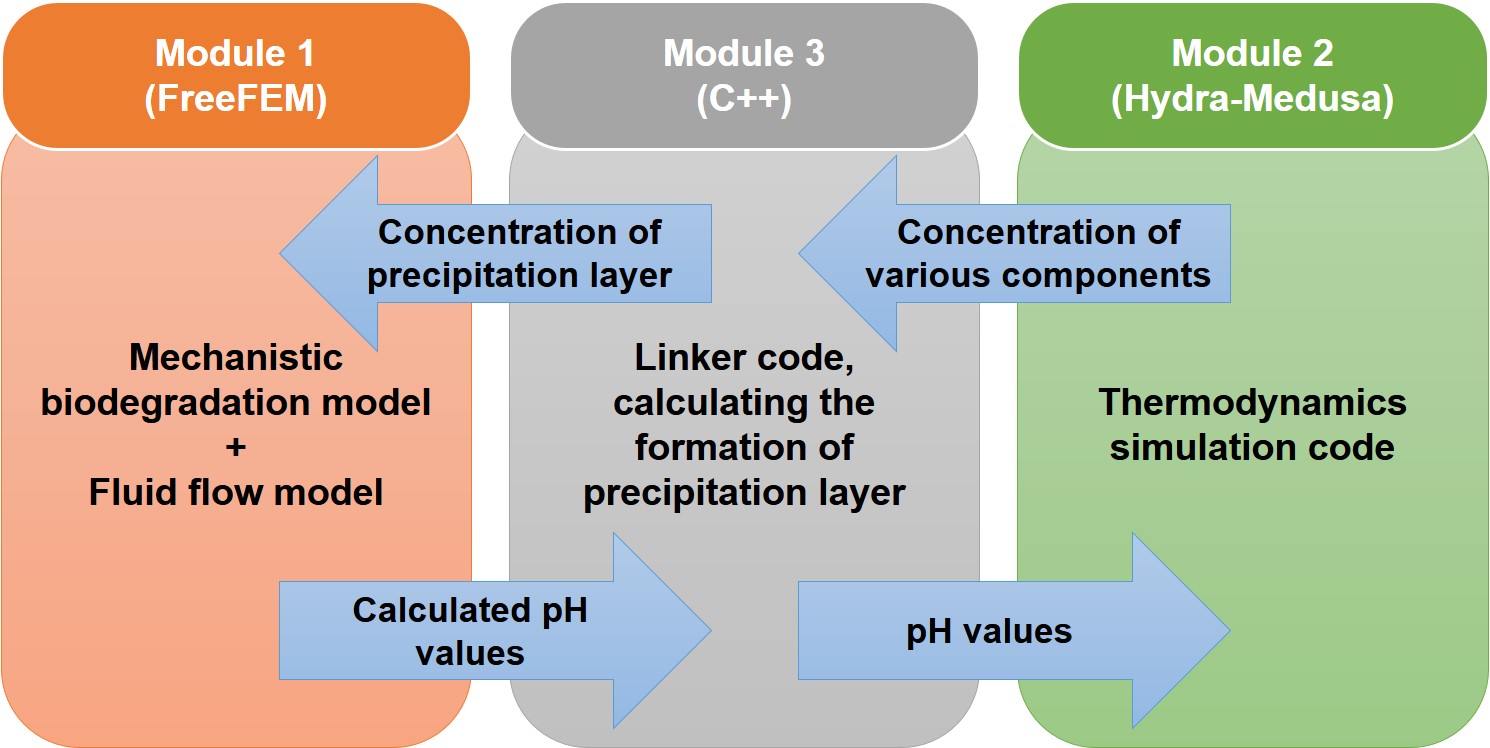
The computational biodegradation model (module 1) was developed by deriving a set of reaction-diffusion-advection equations from the chemistry of the corrosion of Mg in hydrodynamics conditions. The following basic reactions are captured by this model, which is an extension of our previous contribution [31] (Chapter 3) as the overall process is described in more detailed equations:
The following state variables hold the concentration of various basic ions involved in reactions described by Eqs. 5.11, 5.12, 5.13, and 5.14:
Additionally, two more state variables are needed to couple the models, representing the calculated concentration of the hydroxyapatite-like precipitation as well as the cumulative layer concentration:
where the total film concentration can be calculated as:
With the above state variables defined, the biodegradation model can be constructed by implementing the following PDEs:
showing the mathematical representation of reactions 5.11, 5.12, 5.13, and 5.14 in hydrodynamics condition in the form of a set of reaction-diffusion-advection equations. , , and are reaction rate constants corresponding to the Mg oxidation, film formation, and film elimination reactions, respectively. In Eqs. 5.19, 5.20, and 5.22, is defined as:
in which the protective film maximum concentration is calculated using its porosity () [23]:
In Eqs. 5.19, 5.21, and 5.22, is the velocity field from the surrounding fluid flow governed by the Stokes equation:
in which is the fluid velocity, is the pressure (which is actually pressure divided by the density), is the kinematic viscosity (with being the dynamic viscosity), and is the permeability function.
The local pH can be calculated using the simulated concentration of hydroxide (Eq. 5.22):
with being the molecular weight (MW) of the hydroxide ions.
The concentration of the hydroxyapatite-like precipitation ( in Eqs. 5.15 and 5.17) is calculated using the thermodynamics-based simulations (module 2) based on calculated local pH (Eq. 5.26) for each node of the desired domain. After solving the derived equations in each time step, the linking module passes the obtained local pH to the thermodynamics module to calculate the individual concentration of involved chemical components. Then, the individual concentrations are converted to the concentration of the hydroxyapatite-like precipitation by taking into account the stoichiometry of the formation reaction (Eq. 5.10), leading to the calculation of for each node. After this, the total concentration of the film can be calculated according to Eq. 5.17 by passing back the calculated value to module 1.
The thermodynamics-based simulations were conducted using the Hydra-Medusa code [130, 271, 76], in which the input data of chemical equilibrium constants, solubility products, temperature, and involved chemical components are used to generate a set of equilibrium diagrams correlating pH to concentration or fraction of desired chemical components. The experimental conditions, including the initial composition of the electrolyte (Table 5.2) and evaluated temperatures ( and ), were given as input, and contributing components and solubility products were selected as represented in Table 5.3.
| Chemical reaction | ||
| 54.46 | 58.77 | |
| 11.25 | 11.25 | |
| 5.20 | 5.38 | |
| 8.03 | 5.51 | |
| 8.48 | 8.44 | |
| 23.28 | 27.62 | |
| 14.00 | 13.61 | |
| 10.33 | 10.24 | |
| 12.35 | 12.32 |
The derived PDEs for the mechanistic model (Eqs. 5.19, 5.20, 5.21, and 5.22) were solved using a standard first-order finite element scheme. The open-source PDE solver FreeFEM [112] was used to implement the finite element model, resulting in a linear system of equations. The obtained equations were solved in parallel using efficient preconditioners and iterative solvers available in the open-source high-performance computing (HPC) toolkit PETSc [25]. The HYPRE BoomerAMG [78] and FieldSplit preconditioners were applied to the reaction-diffusion PDEs and the Stokes equations, respectively, and the GMRES solver [223] was used to solve the linear systems. Moreover, the computational mesh was partitioned and distributed among available computing resources using the HPDDM preconditioner [140]. Additionally, a Level-Set-based approach was employed to track the change of morphology of the degrading part, on the solution of which appropriate boundary conditions for the PDEs were applied via the penalization method. The details of this implementation are presented in our published works [31, 30] and Chapters 3 and 7. Since Eq. 5.22 is a non-linear PDE, a Picard-relaxation approach was followed to linearize this equation. The linking module (module 3) was implemented as a FreeFEM plugin in C++.
5.2.3 Simulation setup
Since the objective of the current study is to investigate local pH changes in regions close to the degrading metal, the computational domain was selected to include only a small portion of the chamber used in the experimental setup (Fig. 5.1). The domain was a cube on top of the degrading object, and the degrading block, represented as a disc with a diameter of and height of , was attached to the outside of the cube. The cube size was selected such that it represents the sample-centered area used in the experimental setup for line scan mapping. This setup is depicted in Fig. 5.3. The computational mesh was generated using a set of first-order tetrahedral elements, which was adaptively refined on the interface of the degrading sample to increase the numerical accuracy of the employed interface capturing technique. The Netgen mesh engine [233] in the SALOME platform [217] was used to generate the mesh. The generated mesh contained elements with degrees of freedom (DOF) for each equation.
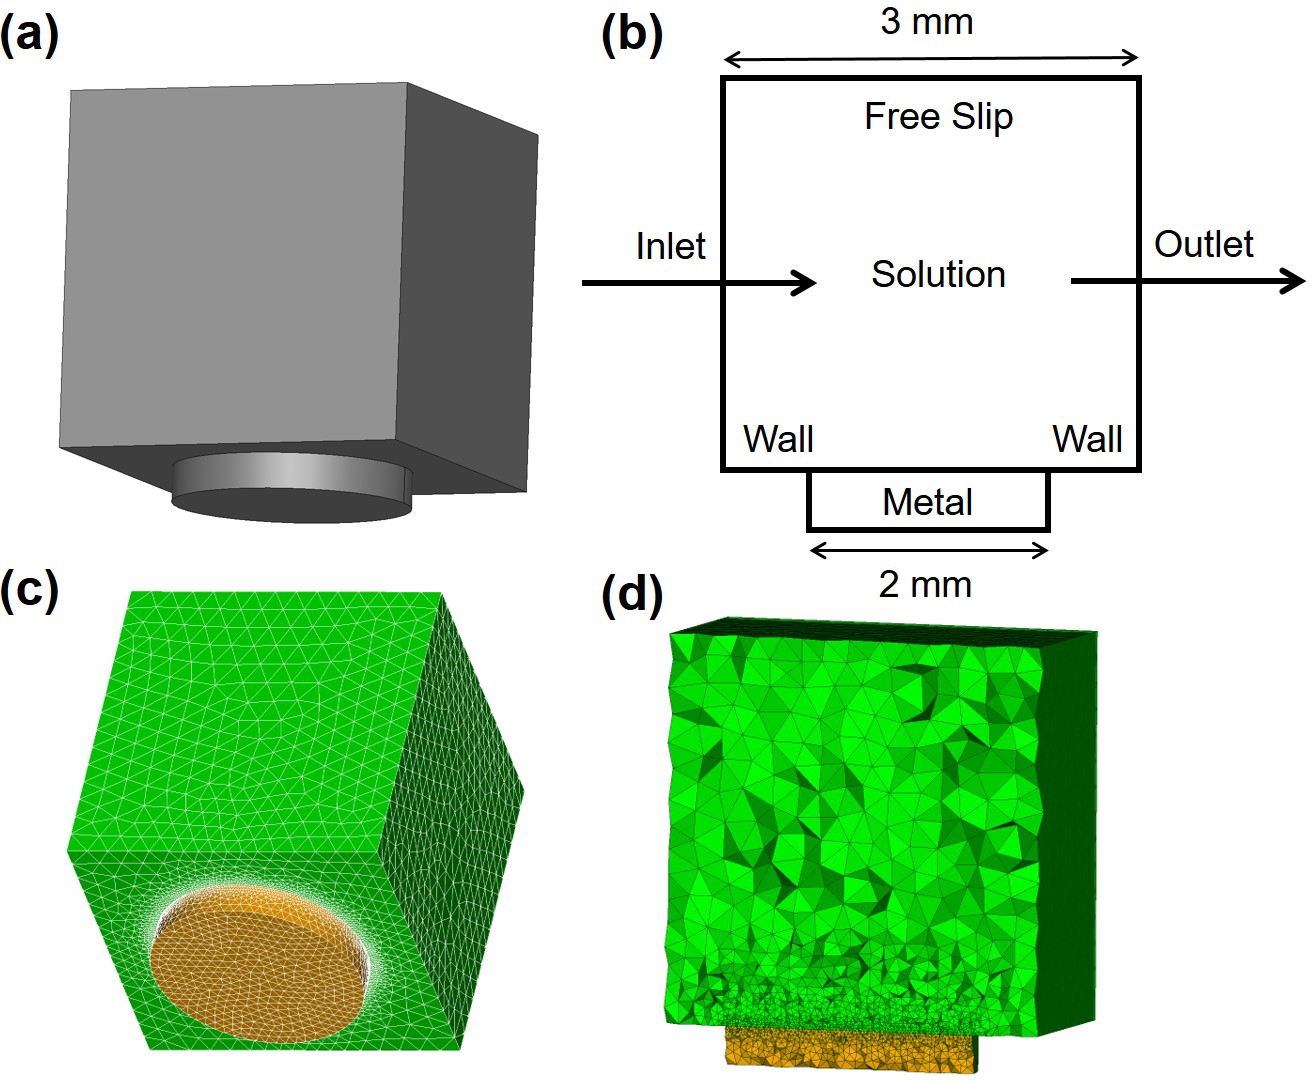
The boundary conditions include an inlet on the left of the box, an outlet on the right, a wall on the bottom except where the degrading part exists, and a free slip on top. The inlet velocity was selected to be a linear profile ranging from zero on the bottom to on the top, a value coming from solving the Navier-Stokes equations in the full chamber model (described in Chapter 4).
The values of model parameters were set based on our previous work [31] (Chapter 3), but the following assumptions were also applied for selecting the proper parameters of the coupled computational model:
The density of the electrolyte was selected to be , and the dynamic viscosity was set to . The simulations were carried out on the Snellius supercomputer using 100 CPU cores on a thin node with 256 GB of total memory.
5.3 Results
5.3.1 Thermodynamics-based simulation
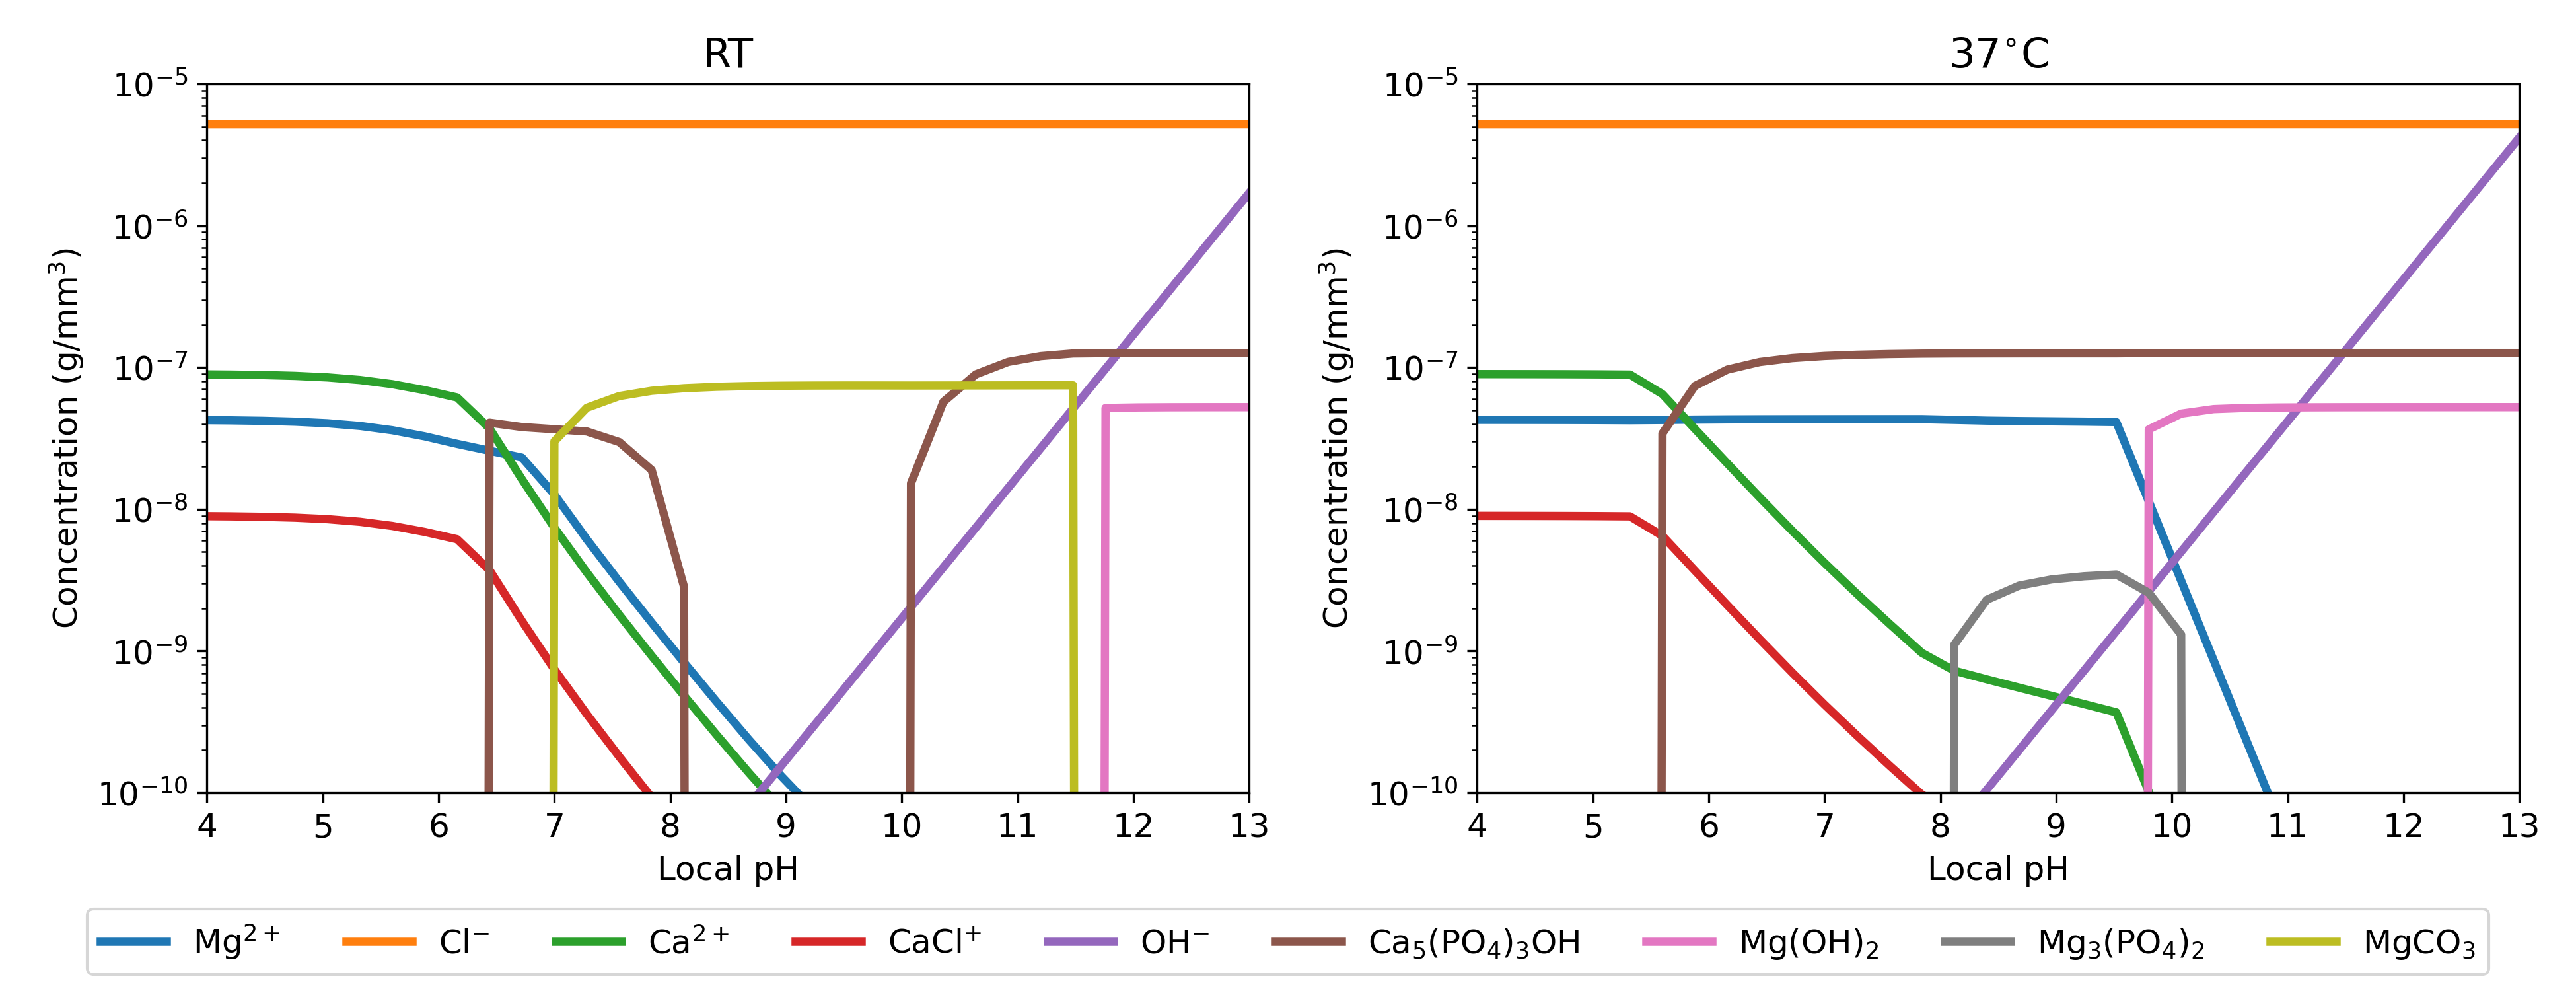
Inputting the experimental conditions in the Hydra-Medusa software, including the initial composition of the electrolyte, temperature and the contributing chemical components, results in a big and complex output containing all the possible occurring chemical reactions. From this output, relevant reactions for the current biodegradation systems were filtered out, and the filtered reactions were converted to desired concentration units. Fig. 5.4 depicts the output of this process separately for simulations performed at (RT) and , showing how the concentration of relevant components varies with changing the environment pH. The solubility products of these simulations were taken from Table 5.3, and equilibrium concentrations were set to be equal to the electrolyte composition, listed in Table 5.2. These results (module 2) were used by the linking module (module 3) to provide equilibrium information for the mechanistic model (module 1).
5.3.2 Biodegradation simulations
In the current study, the local pH profiles, i.e., the pattern of pH changes in the region close to the degradation surface, were used to validate the developed coupled computational model. The comparison between computational predictions and experimental results was made in 3 different ways: 1) qualitative comparison of pH distribution above the degradable metal in a sample-centered square with an edge size of , 2) comparing the horizontal pH profiles, where the pH was measured over a line parallel to the sample, and 3) comparing vertical pH profiles, in which the pH was measured over a distance from the surface of the sample to the bulk of the electrolyte.
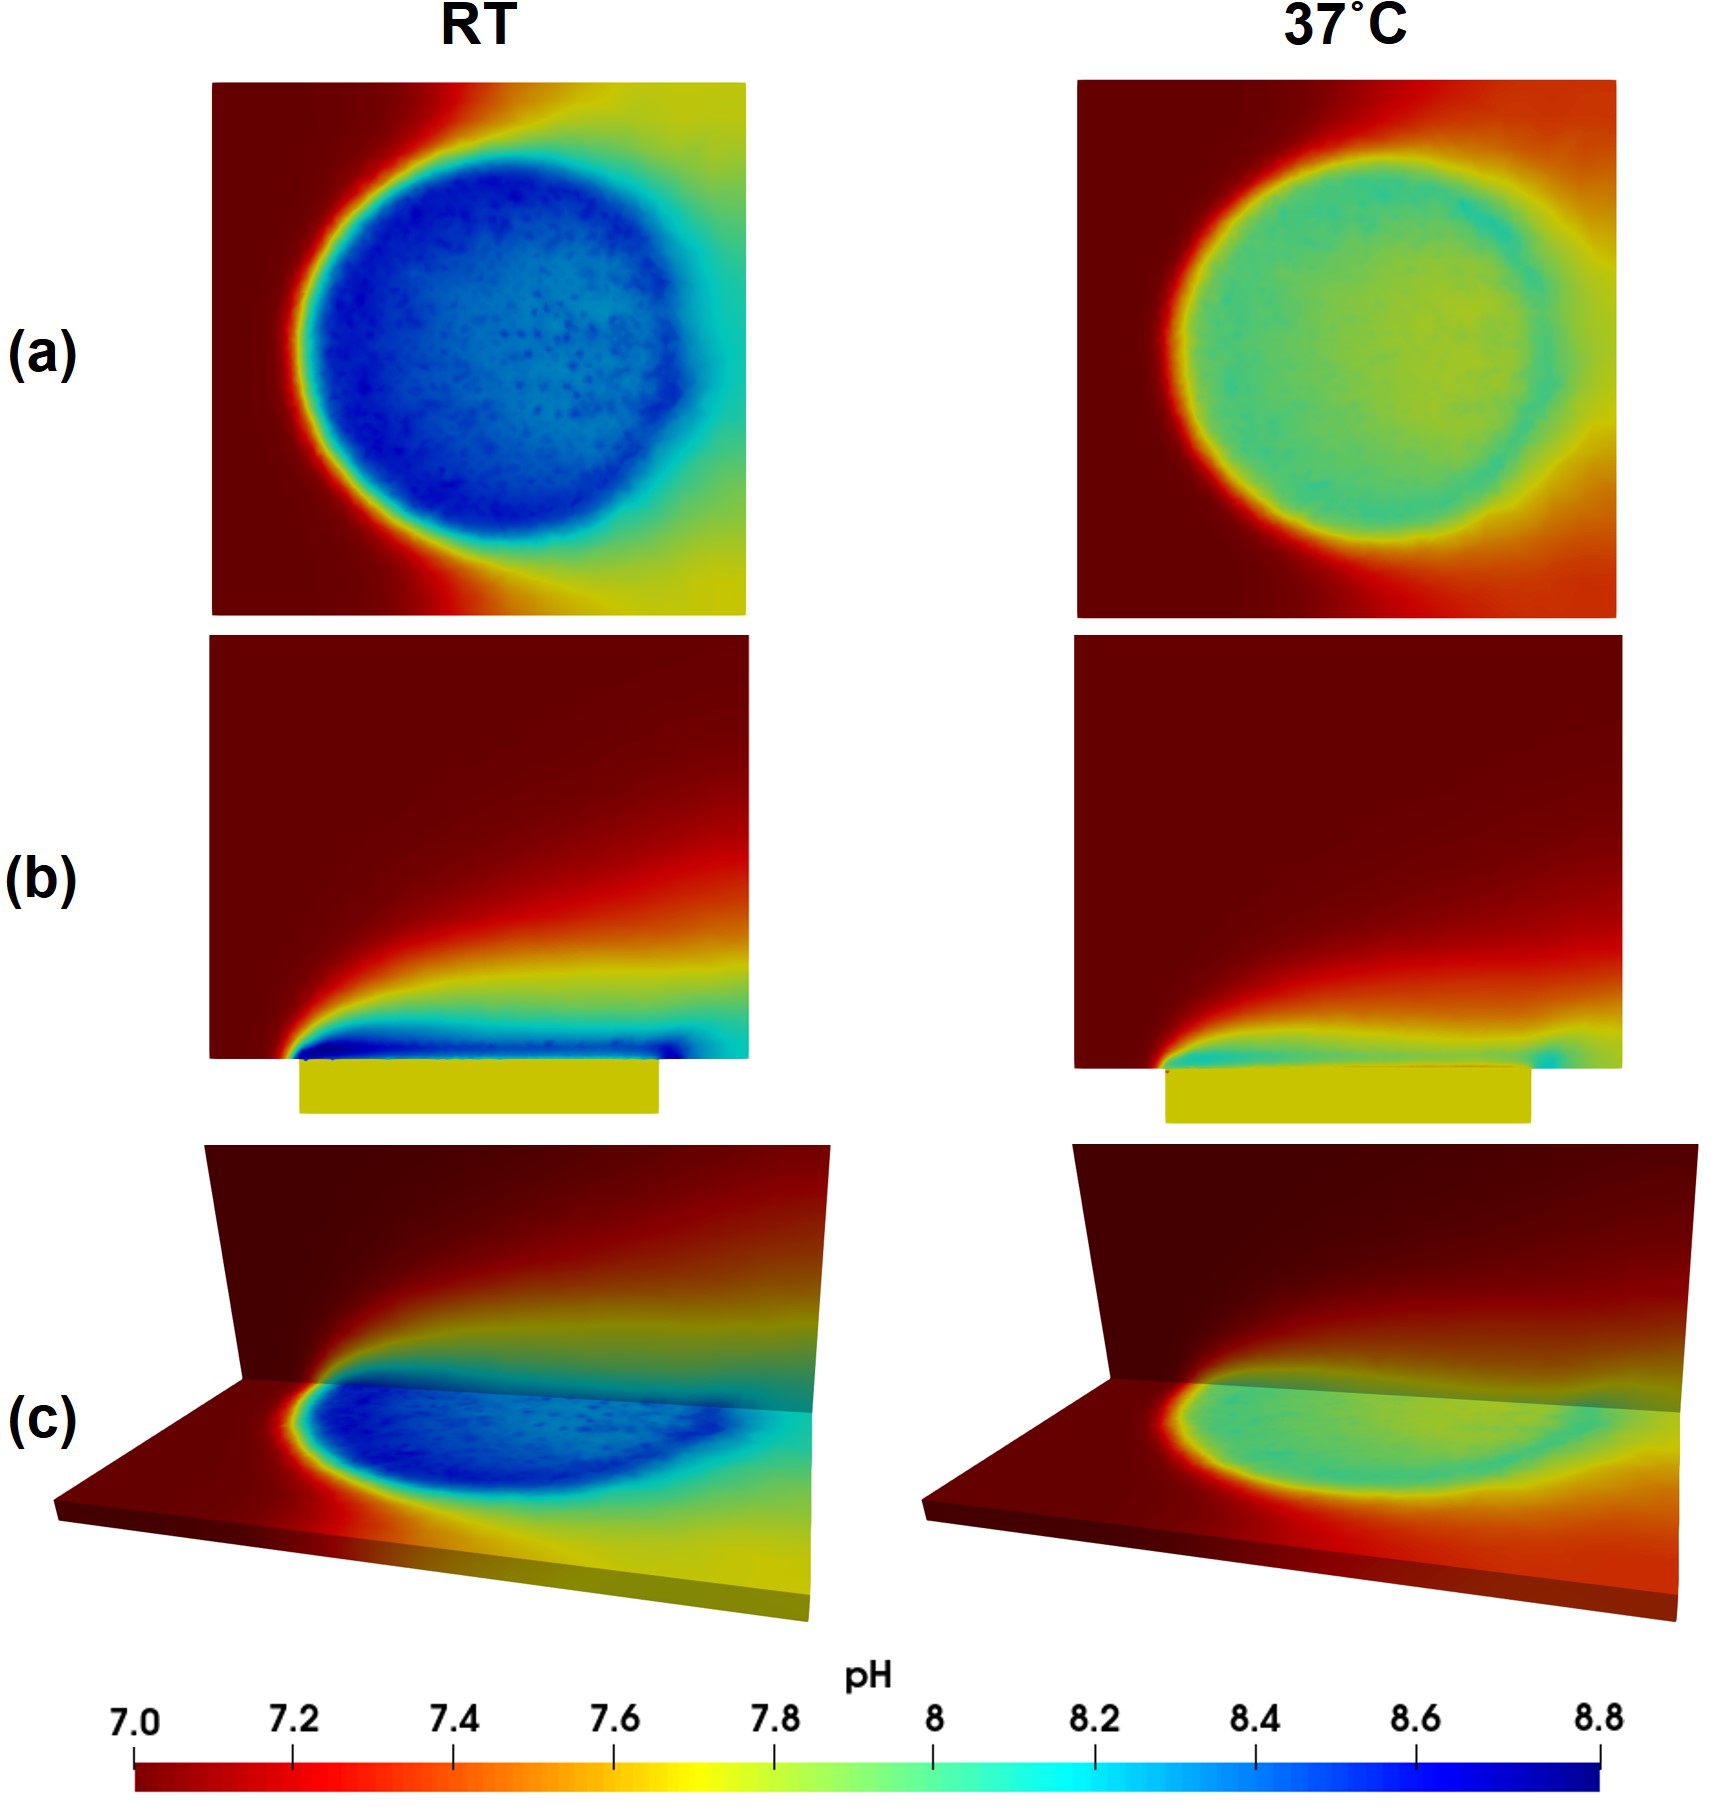
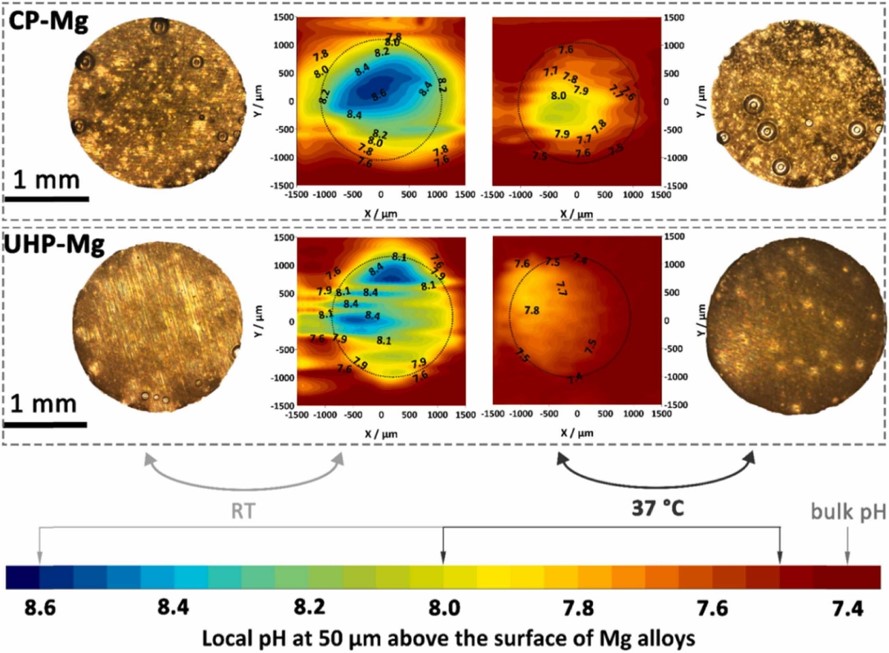
Fig. 5.5 shows a visualization of the local pH profiles from the top and side views for simulations performed at (RT) and after 12 hours. These patterns are comparable with the local pH distribution measured in the experiments, as shown in Fig. 5.6. In these figures, the flow is from left to right, advecting the released ions in the flow direction.
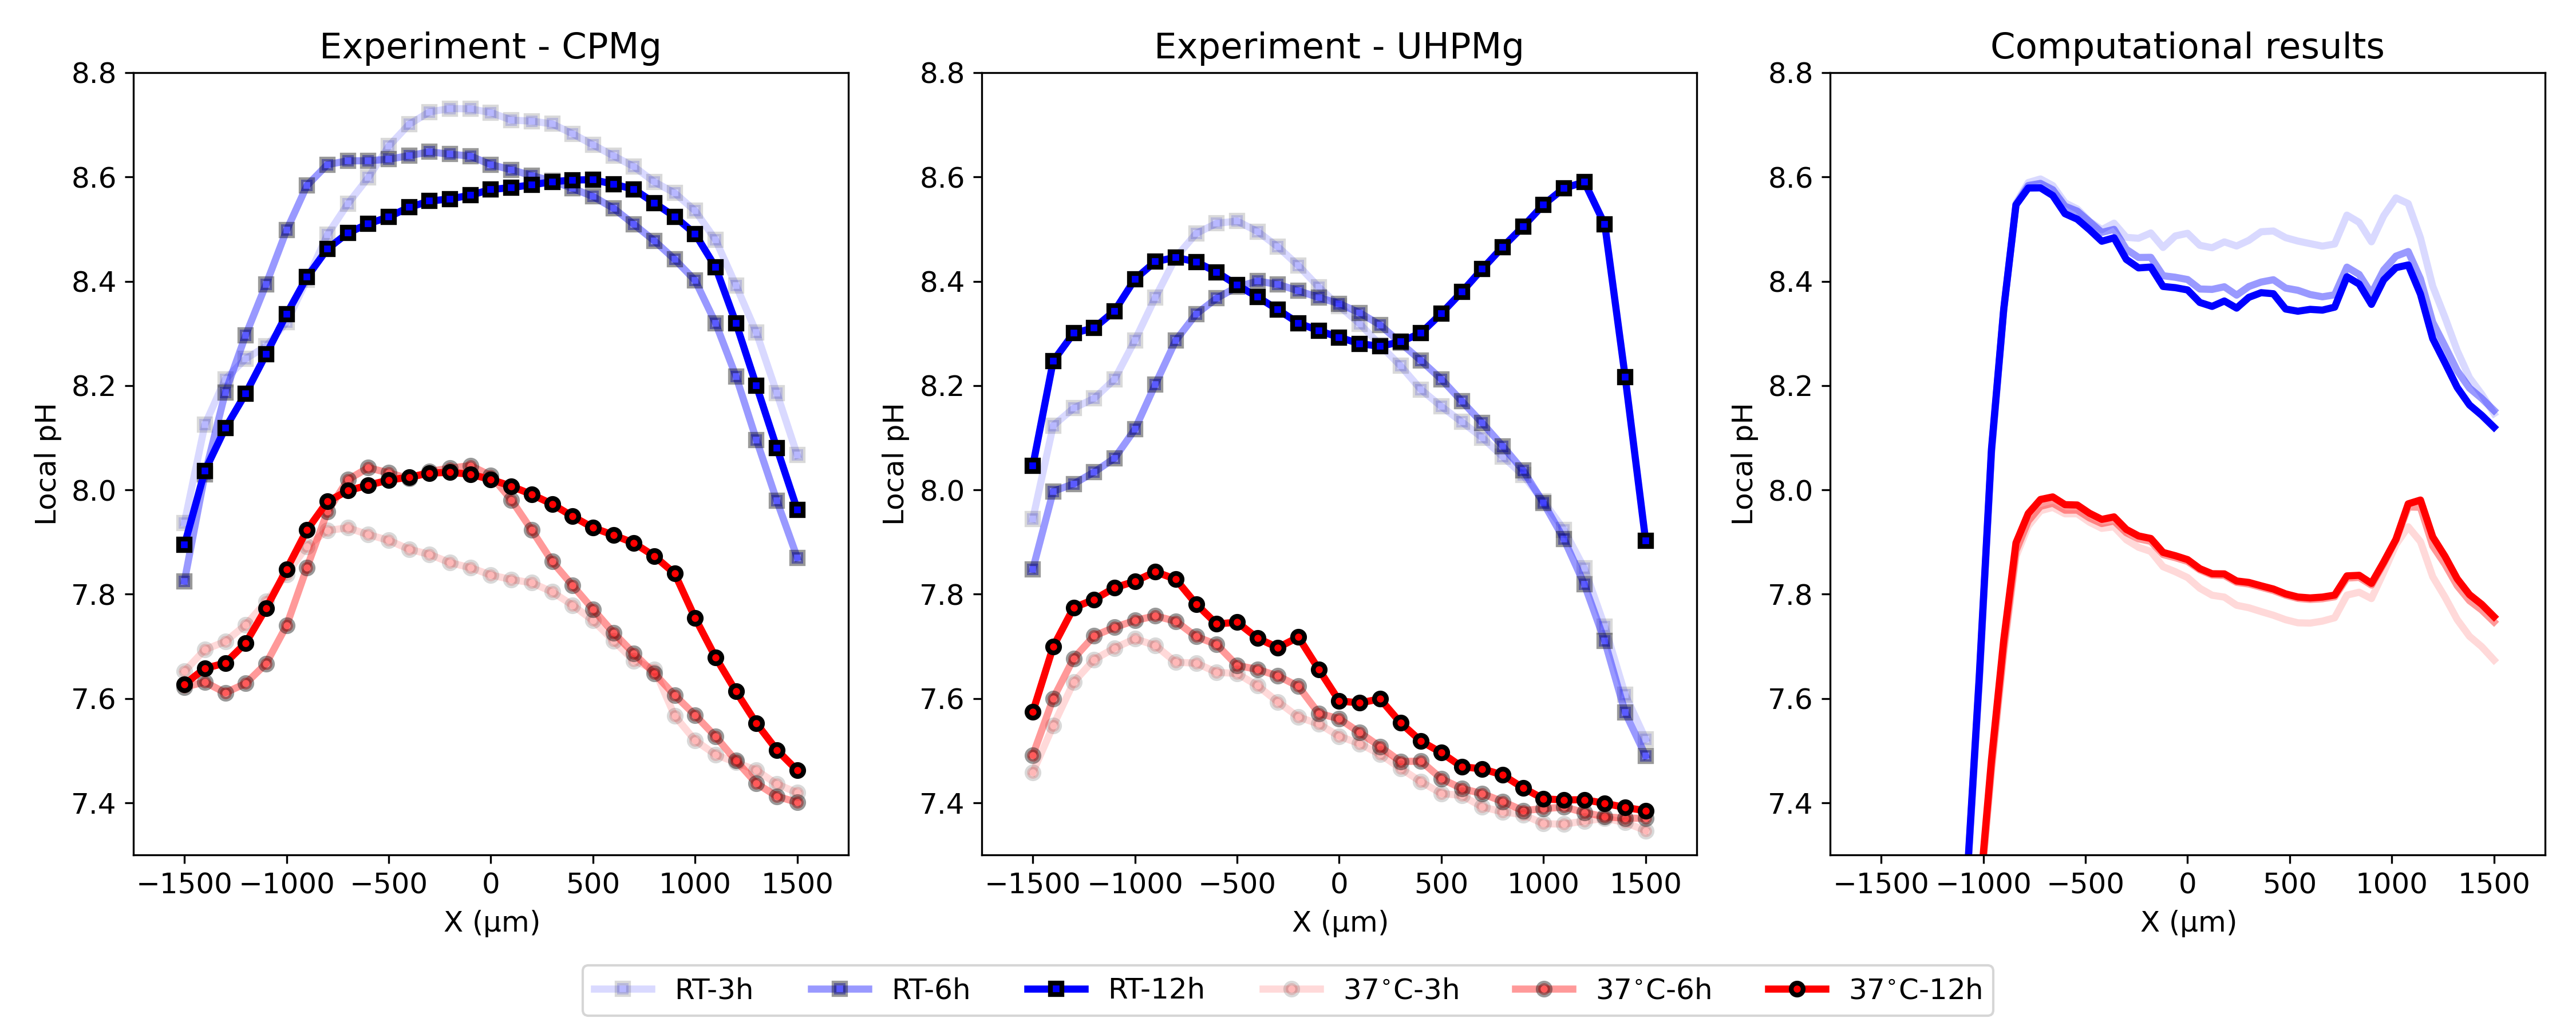
Quantitative profiles provide a more accurate comparison between the computational predictions and experimentally-obtained values. The horizontal profiles, also called line scans, are depicted in Fig. 5.8, in which the local pH changes are plotted over a horizontal line located above the surface of the sample. The profiles are shown separately for the experiments performed with CP and UHP Mg and the computational model. The results were recorded after 3, 6, and 12 hours of immersion.
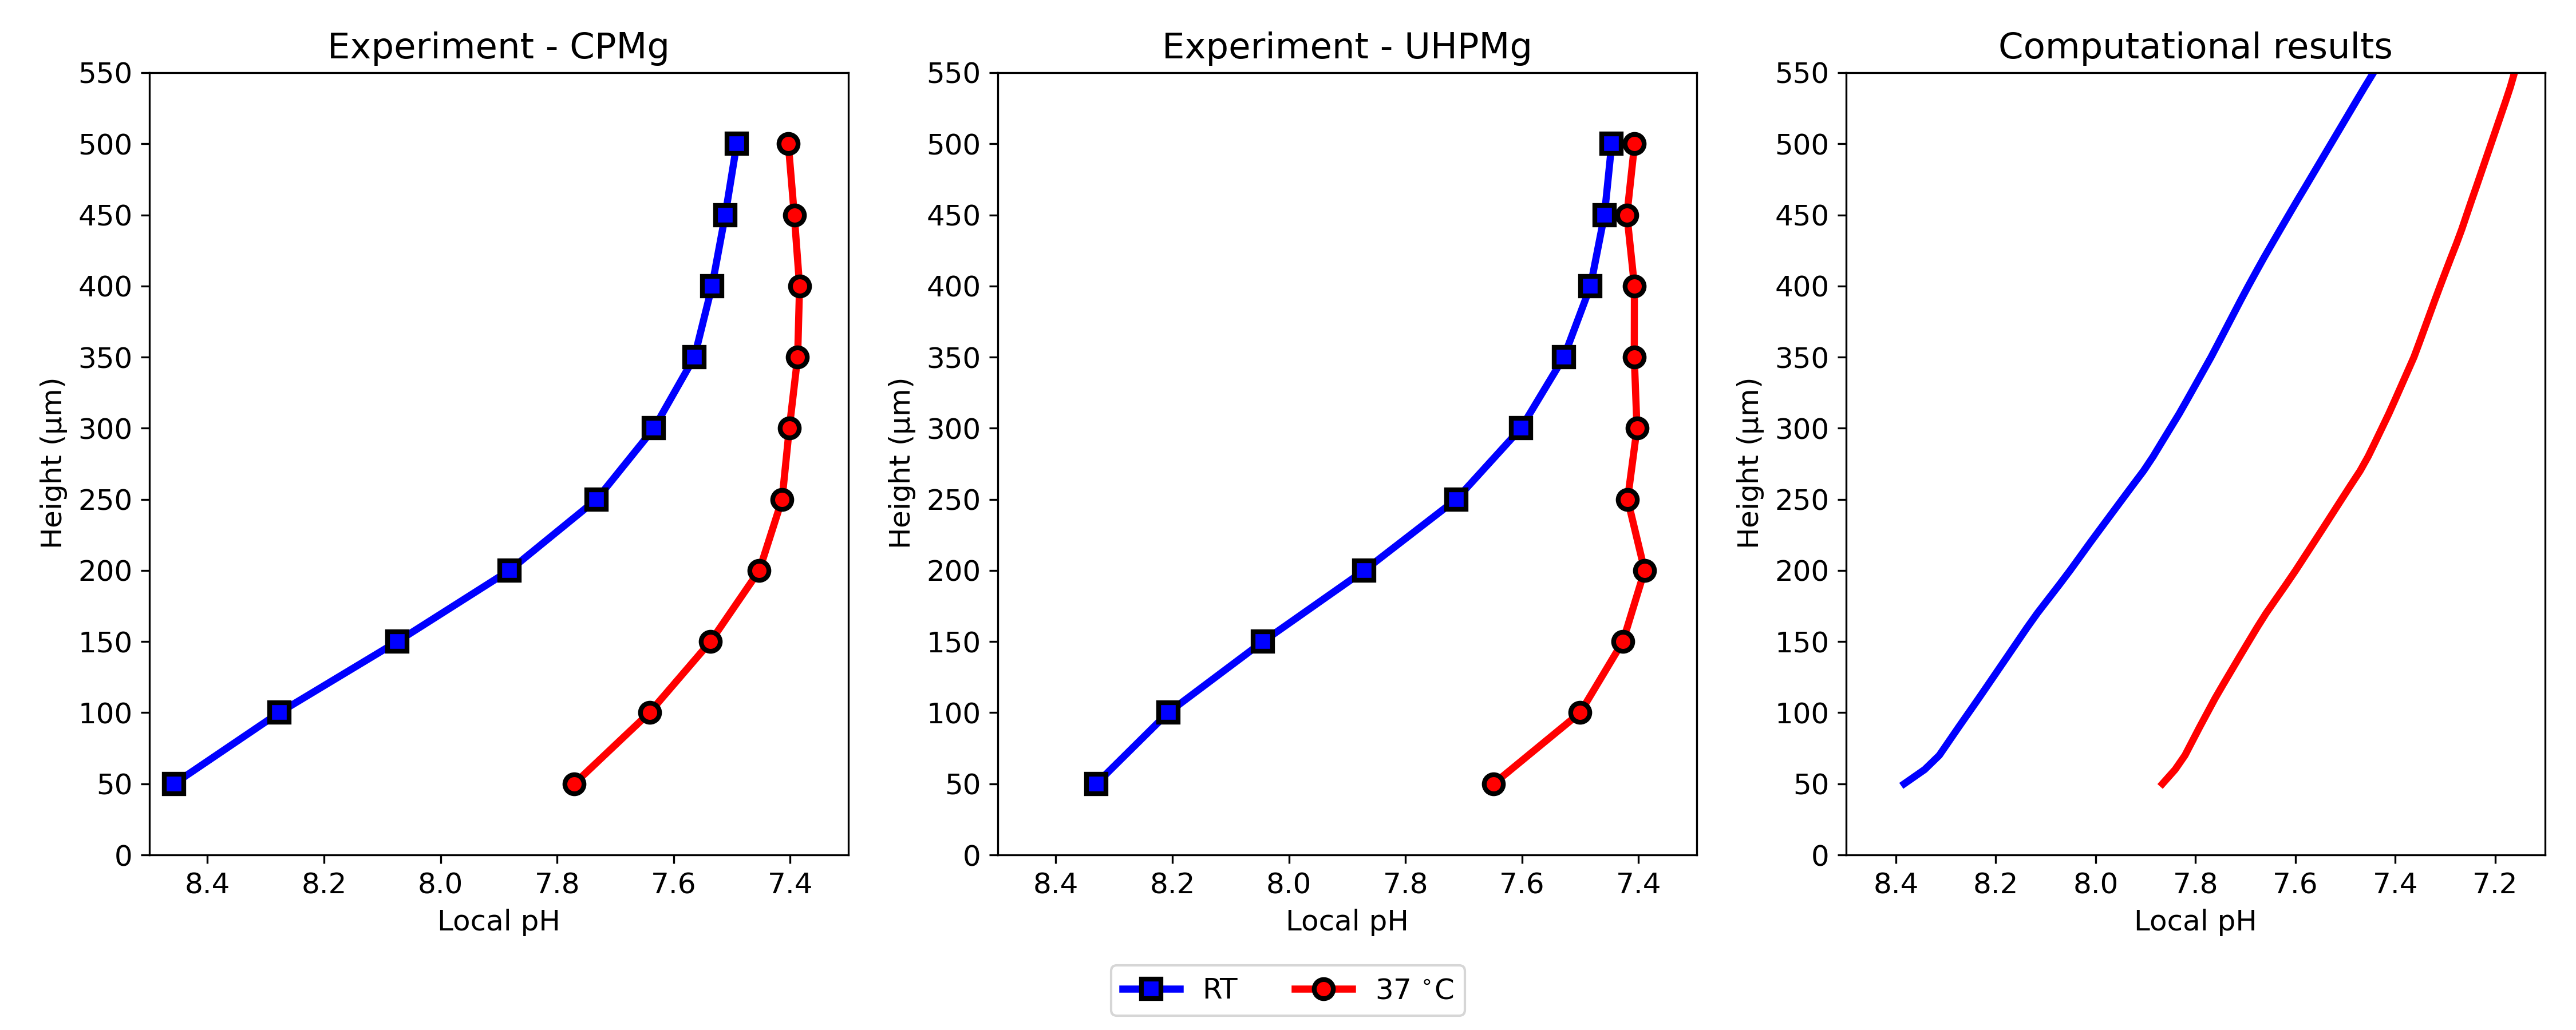
Similarly, Fig. 5.8 shows the vertical pH profile after 12 hours of degradation, which was the final time of the simulation. The local pH is measured over a distance of vertically, starting from above the sample.
5.4 Discussion
In this study, an interface-coupled multiphysics biodegradation model was developed in order to predict the corrosion behavior in simulated body fluids in the presence of various chemical components. The quantity to compare with the experimental results was the predicted local pH, which reflects the capabilities of the model to capture the complex chemistry occurring near the biodegradation interface. For this end, our previous biodegradation model [31] (Chapter 3) was extended and coupled with a fluid flow model capturing the hydrodynamics condition. Then, the coupled model was linked to a thermodynamics-based code for computing the concentration of involved chemical components, the results of which were provided back to the biodegradation model via a linking module to compute the concentration of the precipitation layer.
It has been shown that the local pH changes can be a reflective characteristic of the biodegradation process in SBF-like solutions [92, 266]. Consequently, the vertical and horizontal local pH profiles can be reasonably used for the validation of the computational models of the biodegradation process. Capturing the complex interaction of various chemical components on the biodegradation interface in a mechanistic model can be a big challenge, especially for 3D cases with any arbitrary shape. That’s why several modules were coupled in the current study to deliver such a model.
In this work, while the experiments were performed using CP and UHP Mg, the computational model does not take into account the difference in the elemental composition of these materials. Instead, the biodegradation model was developed by ignoring the effect of alloying elements and impurities. There are noticeable quantitative and qualitative variations in the obtained experimental results, such as different behavior of CP and UHP for horizontal pH profiles in line scan mappings (Fig. 5.7) and distribution of local pH above the sample (Fig. 5.6). However, these differences are still roughly the same behavior and quantity, which support the performed assumption and simplification of ignoring the dissimilarity of elemental composition. As a consequence, the computational results, including the pH profiles (Fig. 5.8), line scans (Fig. 5.7), and local pH distributions (Fig. 5.5), lies between the values and profiles obtained for CP and UHP Mg.
Recent studies on measuring local pH changes on the biodegradation surface of Mg alloys show that the local values are different from the pH within the bulk of the electrolyte [92]. For example, in the tests performed by Mareci et al. [185], such observation was made when the vertical pH profiles were compared to the global pH values. Similar behavior was observed in the Wang et al. work [266]. Reproducing this behavior is problematic in mechanistic computational models due to the uniformity of the diffusion of hydroxide ions that change the pH. In other words, a uniform diffusion with a relatively high diffusion coefficient leads to the same local and global pH values. In the model presented here however, spatially dependent behavior was successfully reproduced in silico by letting a narrow film form at the beginning of the mechanistic biodegradation simulation and then computing the interaction of various ions in this narrow region by using the coupled thermodynamics-based code. Comparing the results of the predicted vertical pH profiles with the experimentally obtained curves (Fig. 5.8) shows good agreement, implying that the employed approach was able to mimic the complex chemistry on the biodegradation surface from a quantitative point of view. Yet, a different behavior can be observed further away from the surface where the local pH approaches the global value. In experimental results, this happens at a shorter distance from the implant compared to the computational predictions (Fig. 5.8) where yielding to the global pH seems to occur at longer distances from the biodegradation surface. This behavior can be confirmed by the visualization of computed pH (Fig. 5.5) and is due to the uniform diffusion mechanism of ions in the computational model, causing a gradient in the bulk part outside of the narrow formed region.
The results of horizontal line scan mapping on the surface of the sample and local pH distribution (Figs. 5.7 and 5.6) show that the pH starts to change in regions above the sample. In the computational predictions depicted in Fig. 5.7, the change of pH starts sharply when the line scan reaches the sample, a behavior rooted in the presence of the fluid flow model, which prevents ions from being diffused to the left, as shown in Fig. 5.5. Similarly, the advected ions in the direction of fluid flow (to the right in Fig. 5.5) prevent the pH value from decreasing dramatically where the sample ends in the line scan mapping. Moreover, the line scans show different behavior for experiments performed at room temperature compared to , especially for CP Mg samples. At RT, the horizontal pH profile tends to descend slightly over time, meaning that the profile measured after 3 hours of degradation is placed above the one measured after 12 hours. This behavior occurs oppositely for the measurement done at . The computational predictions of line scan profiles follow the same pattern, which could be due to how the coupled model computed the change of concentration of various chemical components and their contribution to the change of local pH.
Regarding the horizontal line scan results, a slight increase in the local pH values can be observed in the computational results in the region where the sample ends (Fig. 5.7). Although a similar behavior can be seen in the experimentally-obtained line scans (Fig. 5.6), it should be further investigated from the numerical implementation perspective to make sure that numerical artifacts do not contribute to it. One possible approach that may help remove numerical artifacts in this regard is to make the type of employed boundary conditions consistent in the employed fluid flow model. In the current model, a velocity condition was used for the inlet while the outlet condition was fixed pressure. Using the same type of boundary conditions for both inlet and outlet, meaning either assigning pressure conditions to the inlet or velocity to the outlet, can be considered in further extensions of the model to check their effect on the obtained local pH results.
As mentioned before, various chemical components of the electrolyte contribute differently to the change of pH, among which seems to have the most intricate effect [276]. It has been reported that in the absence of ions, the surface pH tends to be between 10 and 11, the typical range for pH value in biodegradation tests performed in saline solution [92]. This value is in line with the computational predictions of our previous study [31] (Chapter 3). However, in presence of cations, local pH between 7.8 and 8.5 and significantly lower degradation rates are reported [192, 90, 254, 153]. These findings are in line with the predictions made by the model presented in this chapter, obtained by coupling a mechanistic modeling approach and chemical equilibrium modeling, the latter of which considers the presence of .
The simplification assumptions made for developing the computational model, including the correlation between the diffusion rates of hydroxide and Mg ions, higher film elimination rate at room temperature, and the time at which the precipitation layer starts to form, can be seen as the limitations of the developed model. Regarding the latter mentioned assumption, the time was hard-coded into the model due to limitations of implementing the actual mechanisms of inducing the precipitation in the model. This can be improved in further developments of the model by incorporating a kinetics-based description of the precipitation layer formation, similar to the formation of magnesium hydroxide layer defined using a PDE (Eq. 5.20). This improvement will remove the necessity of the assumption made for linking the results obtained in equilibrium using the thermodynamics-based code (module 2) with the kinetics-based model (module 1), which was elaborated in section 5.2.2.
Knowing the mechanism of ionic activities at regions close to the biodegradation interface is crucial for comprehending the chemical process of Mg in complex solutions such as simulated physiological conditions. The developed computational model can be seen as an a facilitating tool for moving towards understanding these mechanisms by making it possible to virtually investigate the effective parameters such as the flow rate and environment composition. This knowledge will be helpful for biomedical applications where new coating and stabilization systems can be developed for different implantation environments.
5.5 Conclusion
In this chapter, the model developed in Chapter 3 was extended and combined with the fluid flow model developed in Chapter 4 to deliver a computational model of the biodegradation process in hydrodynamics conditions capable of predicting local pH changes close to the corrosion surface. In order to simulate local pH evolution in simulated body fluids, the precipitation of the hydroxyapatite-like protective model should be modeled. This was done by coupling the mentioned model with a thermodynamics-based code to compute the concentration of active chemical components contributing to the formation of the protective layer on the degradation interface. Results obtained from the coupled model show a good agreement with experimentally-obtained local pH measurements, demonstrating the effectiveness of the developed simulation workflow.